
Cap Rate Calculator
Analyze investment properties with cap rate, NOI, cash-on-cash return, and expense ratio. Make data-driven real estate investment decisions.
Cap Rate
4.90%
Average — typical for many markets
Net Operating Income
$17,150/yr
Cash-on-Cash (25% down)
19.6%
Gross Rent Multiplier
11.7
Expense Ratio
37.8%
Income
Expenses
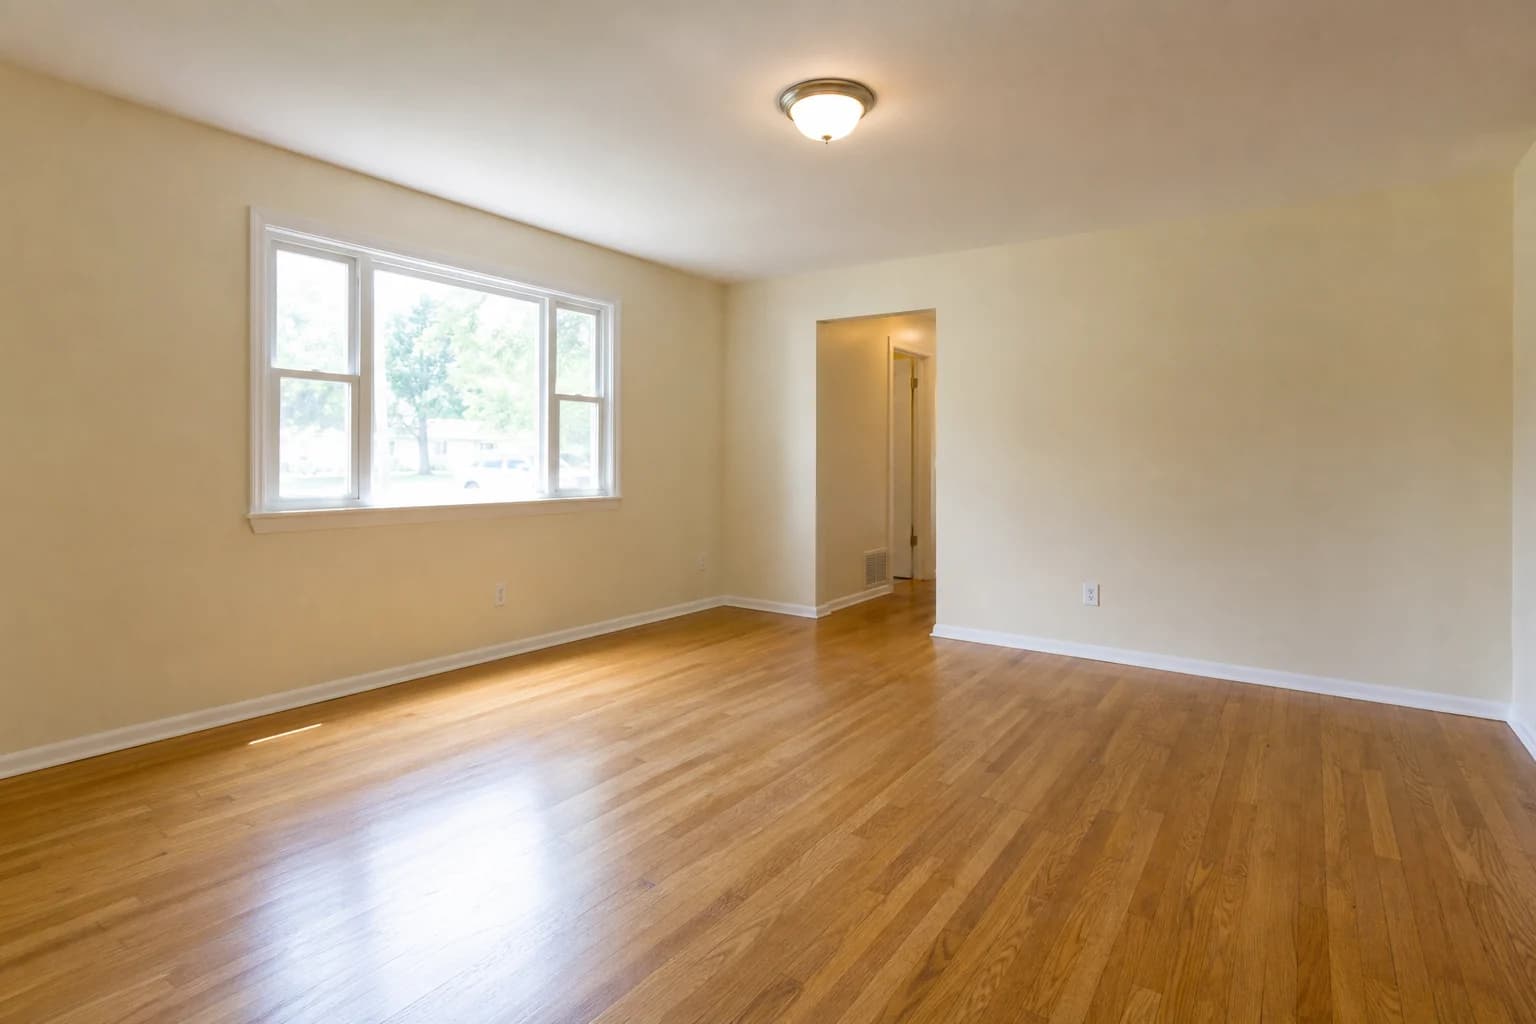
Boost Cap Rate with Staging
Professional staging can increase rent by 5-15%. See the impact on your cap rate:
Current
$2,500/mo
4.90%
+5% Rent
$2,625/mo
5.31%
+10% Rent
$2,750/mo
5.71%
+15% Rent
$2,875/mo
6.12%
Boost Rent with Staging — Improve Cap Rate
Professional staging increases rent by 5-15%. Virtual staging delivers this at $0.10/photo — the highest-ROI marketing for landlords.

Cap Rate Guide
What different cap rates mean for your investment:
2-4%
Low
Prime locations (NYC, SF). Low returns but stable appreciation.
4-6%
Average
Typical suburban markets. Balanced returns and growth.
6-8%
Good
Solid investment territory. Good cash flow with moderate growth.
8-10%
Excellent
High yield markets. Strong cash flow, may need more management.
10%+
High Yield
Value-add or emerging markets. Highest returns but higher risk.
Key Investment Metrics Explained
Cap Rate
NOI / Property Price
Measures unlevered return. Higher = better cash flow. Use to compare properties regardless of financing.
Cash-on-Cash Return
NOI / Cash Invested
Measures return on your actual cash. Factors in leverage. Higher cap rate + more leverage = higher CoC.
Gross Rent Multiplier
Price / Annual Rent
Quick screening metric. Lower GRM = faster payback. Useful for comparing similar properties quickly.
Expense Ratio
Expenses / Gross Income
Shows efficiency. 40-50% is typical. Lower = more efficient. Track to optimize operating costs.
Frequently Asked Questions
What is a cap rate?
Cap rate (capitalization rate) measures the return on a real estate investment property. It is calculated by dividing Net Operating Income (NOI) by the property price. A 6% cap rate means you earn 6% annually on your investment before debt service. Higher cap rates indicate higher returns but often higher risk.
What is a good cap rate for rental property?
A "good" cap rate depends on the market and risk tolerance. Generally: 4-6% is average for stable markets, 6-8% is good for most investors, 8-10% is excellent but may indicate higher risk, and 10%+ often signals value-add opportunities or higher-risk locations.
How is NOI calculated?
Net Operating Income (NOI) = Gross Rental Income - Vacancy Loss - Operating Expenses. Operating expenses include property taxes, insurance, maintenance, repairs, and property management fees. NOI does NOT include mortgage payments or capital expenditures.
What is cash-on-cash return?
Cash-on-cash return measures the annual return on the actual cash invested (your down payment), not the total property value. It is calculated as NOI divided by your cash investment. A 25% down payment on a property with a 6% cap rate may yield 15-20%+ cash-on-cash return.
How does staging affect rental income and cap rate?
Professional staging of rental listings can increase rent by 5-15% and reduce vacancy periods. Even a 5% rent increase on a $2,500/month rental adds $1,500/year to NOI, potentially improving your cap rate by 0.3-0.5%. Virtual staging at $0.10/photo delivers this boost affordably.